Channels
To publish an event, the event must be registered using the ETW API. An XML manifest then defines how the event is published. Windows events can be published to either a channel or an ETW session.
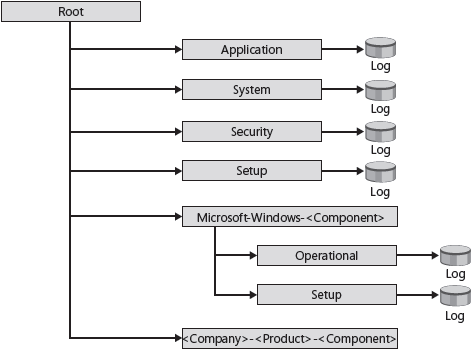
A channel is a named stream of events. Channels are used to transport events from an event publisher to an event log file so that an event consumer can get the event. Figure below shows the structure of the channels and event logs in Windows Vista and later versions. Windows Vista and later versions include the following types of channels:

- System System channels include the System, Application, and Security event log channels. These channels are created when Windows is installed on the computer.
- Serviced Serviced channels include the following:
- Admin Events in this channel primarily target administrators, support technicians, and users. Admin events generally indicate problems that have well-defined solutions that you can act on.
- Operational Events in this channel are used for analyzing and diagnosing a problem with the computer. Operational events can be used to trigger tasks or tools for troubleshooting problems.
- Direct Direct channels include the following:
- Analytic Events in this channel describe problems that cannot be resolved by user intervention. Analytic events are published in high volume and can be queried but cannot be subscribed to. Analytic channels are disabled by default.
- Debug Events in this channel are used by developers or support technicians for debugging system and application issues. Debug channels are disabled by default.
Note Analytic and Debug channel event information should first be converted to the standard Event Log (.evtx) file format to make it easier to read in Event Viewer.
By default, an event log file is attached to each channel except the analytic and debug channels. The event logs for those channels are disabled by default and are hidden from view in Event Viewer. To make Analytic and Debug event logs visible in Event Viewer, select Show Analytic And Debug Logs from the View method. Once these logs are displayed, you can selectively enable them by right-clicking on them and selecting Enable Log.
In this tutorial:
- Windows 7 Desktop Maintenance
- Performance Monitoring
- Improvements to Performance Monitoring in Windows 7
- Using Performance Monitor
- Real-Time Performance Monitoring
- Performance Monitor Logging
- Creating a Data Collector Set
- Configuring a Data Collector Set
- Using Data Manager to View Performance Data
- Starting and Stopping Data Logging
- Viewing Performance Data
- Comparing Performance Monitor Logs
- Performance Monitor User Rights
- Remote Data Collection
- Using Windows PowerShell for Performance Monitoring
- Resource Monitor
- Overview Tab
- CPU Tab
- Memory Tab
- Disk Tab
- Network Tab
- Reliability Monitor
- How Reliability Monitor Works
- Windows Performance Tools Kit
- Event Monitoring
- Understanding the Windows Event Architecture
- Channels
- Improvements to Event Monitoring in Windows 7
- Using Event Viewer
- Understanding Views
- Viewing Event Logs
- Saving Event Logs
- Configuring Event Subscriptions
- Considerations for Workgroup Environments
- Creating a New Subscription
- Using the Windows Events Command-Line Utility for Event Monitoring
- Using Windows PowerShell for Event Monitoring
- Using Task Scheduler
- Improvements to Task Scheduler in Windows 7
- Understanding Tasks
- Understanding the Task Scheduler Architecture
- Understanding Task Scheduler Security
- Credentials Management
- Securing Running Tasks
- Understanding AT and Task Scheduler v1.0 Compatibility Modes
- Understanding the Task Scheduler Snap-in
- Understanding Default Tasks
- Creating Tasks
- Defining Triggers
- At Startup Trigger
- On Connection To AND Disconnect From User Session Triggers
- On Workstation Lock AND Unlock Triggers
- Defining Actions
- Defining Conditions
- Defining Settings
- Managing Tasks
- Viewing History
- Using SchTasks.exe for Creating and Managing Tasks
- Task Scheduler Events
- Troubleshooting Task Scheduler
- Tasks Won't Run If the Service Is Not Started
- The Task Will Run Only When a Certain User Is Logged On
- The Task Action Failed to Execute
- Interpreting Result and Return Codes
- Understanding the Windows System Assessment Tool
- Understanding WinSAT Assessment Tests
- Examining the WinSAT Features Assessment
- Running WinSAT from the Command Line
- Understanding WinSAT Command Exit Values
- Running WinSAT Using Performance Information and Tools
- System Capabilities Section
- OEM Upsell And Help Section
- Understanding Windows Error Reporting
- Overview of Windows Error Reporting
- How WER Works
- Store Management System
- ReportArchive Folder
- WER Service
- Understanding the Error Reporting Cycle
- Understanding WER Data
- Configuring WER Using Group Policy
- Configuring WER Using the Action Center
