
Monitor performance using Task Manager
If you have used an earlier version of Windows, you probably have used Task Manager. This is one of the most useful tools available in Windows for gaining an immediate insight into how a system is performing.
Access Task Manager
The Task Manager built into Windows 10 shows you which processes (tasks) are running on your system and, importantly, shows the system resource usage that directly relates to performance. If a particular task or process is not responding, or continues to run after you have closed the application, you can use Task Manager to view this behavior and force the offending process to end.
When troubleshooting, you might find that some users are comfortable using Task Manager to review the system status and end problematic tasks.
If you are moving to Windows 10 from Windows 7 or earlier, notice that Task Manager has been redesigned extensively and is now much more user-friendly, informative, and colorful and slightly less technical.
To open Task Manager, right-click the Start button and then click Task Manager. There are several other ways to open Task Manager, including Ctrl+Shift+Esc or right-clicking the taskbar, Cortana, or the Task View button and then clicking Task Manager.
By default, the Task Manager opens to show only the running applications. While using this view, you can highlight any of the listed applications and click End Task to stop a running app.
If you click More Details, Task Manager reopens and displays seven tabs, which enable you to review specific areas of your computer activity. The tabs are described in Table below.
Task Manager 	Description
Tab

Process		Shows all running apps and
		background oricesses.

Performance	Show real-time statistics for
		CPU, memory disk, Ethernet,
		Bluetooth, and Wi-Fi usage.

App History	Show historical data for
		universal and modern apps
		usage for the previous month.

Startup		Lists the apps that start when
		the computer boots.

Users		Lists all the users currently
		logged on to the computer
		loally and remotely.

Details		Shows detailed statistics on
		all running and suspended
		processes.

Services	Displays all running and
		stopped system services.
Each tab offers you a different view of the system. Most users might be interested only in the simple view, whereas most IT professionals will only use the detailed version of Task Manager.
Processes tab
All running apps and background processes are grouped as shown in Figure below, and within each process, there might also be more detail. Where an app or process has an arrow beside it, you can click the arrow to see the related processes. For example, if you are running Word and have two documents open, when you click the arrow next to the Word app, the display expands to show both instances of the app that are running. If you highlight an app instance or process and click End Task, Windows 10 attempts to close the activity.
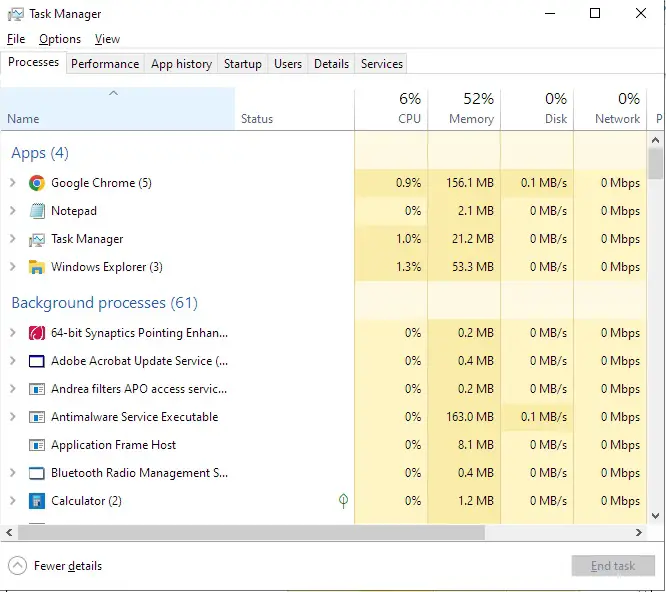
The new visual appearance of the Processes tab contents is representative of a heat mapping of the data. This is designed to be easier for you to spot the high resource usage and problematic issues requiring attention or further investigation.
Each of the data columns on the heat map is sortable by clicking each heading, such as Memory or Disk. Notice that when you click a column heading, all apps and processes are listed together and are no longer grouped in the first column.
Performance tab
The Performance tab provides a graphical, real-time, statistical view for CPU, Memory, Disk, and Ethernet. If you have multiple Ethernet devices, such as Wi-Fi, these are listed. Figure below shows the Performance tab with disk 0 selected. There are three volumes on Disk 0, and these are aggregated as a single disk. In the lower pane, below the graphics, you see additional information such as read/write speed, capacity, and average response time. If you are connected to Wi-Fi and click Ethernet, you see the adapter name, Service Set Identifier (SSID), Domain Name Service (DNS) name, connection type, IPv4 and IPv6 addresses, and signal strength.
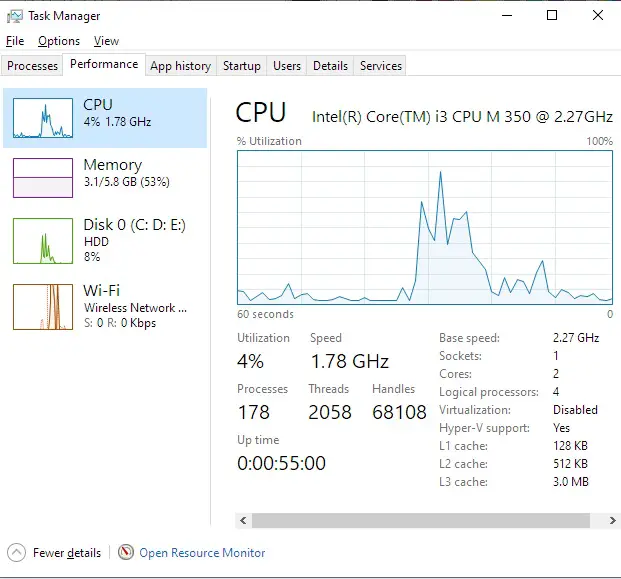
At the bottom of the Performance tab is an Open Resource Monitor link to the management console.
App History tab
The App History tab shows a list of all modern apps that are installed on the device. The table format lists the app usage for the previous month, and columns include CPU Time, Network, Metered Network, and Tile Updates. Where an app has related apps, such as the Messaging + Skype item, the results show aggregated usage totals for Skype Video and Messaging. The grid uses color to highlight the items that are using the most resources within each column.
If you right-click the name of an app, you can select Switch To, which launches the app.
Startup tab
The Startup tab displays which apps start when Windows 10 launches. The information appears in a table, and the columns include Name, Publisher, Status, and Startup Impact.
Under each column is displayed the status or setting for each app. You can enable or disable each app to allow or prevent it from starting when Windows starts. The startup impact caused by the app is an indication of what resources the app is using and how long it takes to initialize; it's categorized by None, Low, Medium, or High.
If you right-click one of the app names, the context menu allows you to:
- Toggle the Disable/Enable status for the app.
- Open File Location for the app.
- Search Online for details of the app.
- Launch the app Properties.
Users tab
All users currently logged on interactively or remotely are displayed on the Users tab. The information is displayed in table format, and the default columns include User, Status, CPU, Memory, Disk, and Network. You can right-click the column heading and select additional information to be displayed.
If the user signed on using a Microsoft account, the user name is the email address associated with the Microsoft account. On shared devices, such as a home computer on which users may access HomeGroup or still be logged on concurrently, you can review the impact on the computer resources for each active user.
If you right-click a user, you can expand the tree to view the active processes for the user. You can terminate any process in this list by selecting a single process and then clicking End Task.
If you want to end the session that the user has on the computer, you can disconnect a user by right-clicking the user and clicking Disconnect. The user will be informed by a pop-up window that they have been disconnected.
Details tab
All running processes are displayed on the Details tab. The information is displayed in table format, and the default columns include Name, Process ID (PID), Status, User Name, CPU, Memory (private working set), and Description.
You can right-click the column heading and select additional information to appear, including Package Name, Session ID, CPU Time, Page Faults, Threads, and many more. The information displayed is the same as was reported on the Windows 7 Task Manager Processes tab.
If you right-click a process, you can then select several options, including End Task, End Process Tree, Set Priority, Set Affinity, UAC Virtualization, Create Dump File, Open File Location, Search Online, Properties, and Go To Services.
Services tab
The last tab displays all services that are available on the device. These include the status of Running or Stopped. If you right-click a service, you can then select from the context menu to Start, Stop, Restart, Open Services, Search Online, and Go To Details for each service. Some options are only available for services that are running. At the bottom of the Services tab is a link to open the Services management console.