Creating Your First Select Query
Quite often, when you are working with or analyzing data, it is preferable to work with smaller sections of the data at a time. The tables contain all the records pertaining to a particular entity, but perhaps for your purposes you need to examine a subset of that data. Typically, the subsets are defined by categories or criteria. The select query enables you to determine exactly which records will be returned to you.
If you thought that creating queries required learning a programming language or some other technological hurdle, you are mistaken. Although it is possible to create queries using the programming language of databases (SQL), Access provides a graphical interface that is easy to use and quite user-friendly. This graphical interface has been called the QBE (Query by Example) or QBD (Query by Design) in the past. Now Microsoft calls it the Query Design view. In the Query Design view, tables and columns are visually represented, making it easy to visualize the question you would like to ask of the data.
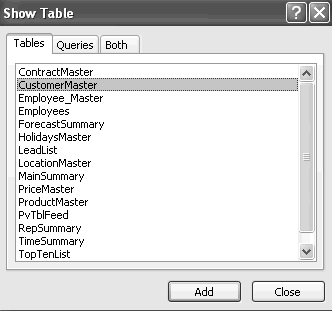
Go up to the application ribbon and select the Create tab. From there, select Query Design. The Show Table dialog box now opens on top of a blank Query Design interface, as shown in Figure below. The white grid area you see in the Query Design view is often called the query grid.

When creating your question of the data, the first thing you must determine is from which tables you need to retrieve data. The Show Table dialog box enables the user to select one or more tables. As you can see in Figure above, there are also tabs for Queries and Both. One of the wonderful features of queries is that you are not limited to just querying directly from the table. You can create queries of other queries.
For this first query, select the CustomerMaster table, either by selecting the table in the list and clicking Add or by double-clicking on the table in the list. Now that you have selected the table from which you want to retrieve data, you can close the Show Table dialog box and select the fields of that table that you would like to retrieve.
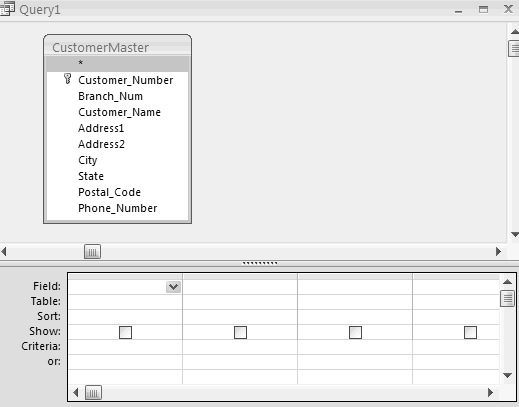
The Query Design view is divided into two sections. The top half shows the tables or queries from which the query will retrieve data. The bottom half (often called the query grid) shows the fields from which the query will retrieve data. You will notice in Figure below that the CustomerMaster table shown at the top half of the Query Design view lists all the fields but has an asterisk at the top of the list. The asterisk is the traditional database symbol that means that all fields from that table will be in the output.

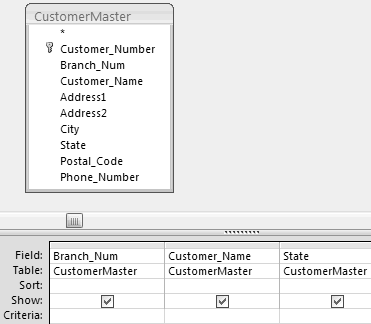
For this example, select the following three fields: Branch_Num, Customer_Name, and State. To select fields, you can either double-click the field or click it once and drag it down to the bottom half (the query grid). Each field that you add to the query grid will be included in the output of the query. Figure below shows you how your query should look after selecting the output fields.

At this point, you have all you need to run the query. To run the query, click the Run button located on the Design tab. The output from a query looks similar to a regular table after it is open.
NOTE: To return to the Query Design view, simply click View on the Home tab and then select Design View.
Sorting Query Results
Now examine how you can sort the results of this query. Just as you sorted in Excel, you are going to select a column and choose between an ascending sort and a descending sort. In the query grid, notice the Sort row of the grid. This is where you can select either one or multiple sort columns. If you select multiple sort columns, the query will sort the results in order of left to right.
Go to the State column and click your mouse on the Sort section. As shown in Figure below, a drop-down box appears, enabling you to select either Ascending or Descending for that particular column.
The sort order options for a column are provided by the Query Design view.
Select Ascending and rerun the query. When you ran the query before, the states were in no particular order. After setting the sort order of the State column to ascending, the query output simply looks better and more professionally formatted.
The results of the query are now sorted in ascending order by the State field.
Filtering Query Results
Next, you will examine how you can filter the query output so that you retrieve only the specific records to analyze. As in Excel, in Access this filter is also called Criteria. Note the Criteria row in the query grid. This is where you will enter the value or values for which you would like to query. When entering a value in the Criteria section, all records that match it are returned in the query output. When entering text, you must enclose the text string with quotation marks. You can either place them there yourself or type your text and click another part of the query grid. Access then automatically places quotation marks around your criteria if the field you are filtering is a text field.
In the example, your manager wants to see the list of customers from California. Since California is designated by the abbreviation CA in the table, that is exactly what you will enter in the Criteria row of the State column.
After you run the query, you will notice that fewer records are returned. This is obvious from looking at the Record Selector at the bottom of the query output window. Aquick scan of the results verifies that indeed only records with CA in the State column were returned.
You can sort and filter query results just as if they were a Table. Simply click the drop-down arrow next to each of the column headings to active the sorting and filtering context menu.
Querying Multiple Tables
How you can perform a query on multiple tables. Remember that you split your data into separtate tables. You used Relationships to define the logical relationships between the data. Now you will query from the tables based on the relationships that were established.
For example, say you want to see the customer transactions from California. A quick examination of the TransactionMaster reveals that there is no State field on which you can filter. However, you see that there is a CustomerNumber field. In your Access relationships, you defined a one-tomany relationship between the Customer_Number primary key in CustomerMaster and the Customer_Number foreign key in the TransactionMaster table. Another way to think of it is filtering the TransactionMaster indirectly by filtering a table that is related to it and using those results to determine which TransactionMaster records to return.
In the query that you already have opened, add the TransactionMaster table so you can include some fields from that table in your query output. Right-click the top half of the Query Design view and select Show Table. Double-click the TransactionMaster table to add it to the Query Design view. You will notice that the previously established relationship is automatically represented, as shown in Figure below. You can see the one-to-many relationship, indicating possible multiple records in TransactionMaster for each individual customer in the CustomerMaster table.

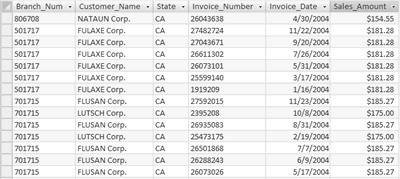
You must now select the fields from your newly added table, which you need to appear in the query output. Examine the individual invoices and invoice amounts that were issued to customers from California. Select the following three fields from the TransactionMaster table: Invoice_Number, Invoice_Date, and Sales_Amount. The field names from the two tables are brought together in the query grid.
Figure below show, you now have the invoice data matched with its appropriate customer data. Although there is repeating data, as with your flat-file examples, there is a significant difference. The repeating data is being read from a single source, the CustomerMaster table. If a value were to change in the CustomerMaster table, that changed value would be repeated in your query results. You have overcome potential update errors inherent with duplicate data.

Refining the Query
You can narrow your results down even further by filtering the query results according to a certain date. As you can see, there are several rows of criteria cells. These enable you to enter multiple criteria from which to filter. One thing to keep in mind is that each separate criteria row functions as its own separate set of criteria. Take a look at how this works.
Click the Criteria cell in the Invoice_Date column and type 4/20/2004. When you click outside that cell, you will notice that number signs (#) now surround the date. When running this query, only results matching the two criteria (State = 'CA' and Invoice_Date = 4/20/2004) are returned.
Now look at using multiple criteria for a single field. For example, say you want to bring in invoices for the data 11/19/2004 as well as 4/20/2004. You will want to add the new criteria line below the existing criteria. This will have the effect of testing the records for either one criteria or the other.
Since you want to limit your query to only results from California, you must retype "CA" on your new Criteria line. If you do not do that, the query will think that you want all invoices from California on 4/20/2004 or invoices from all states on 11/19/2004. The criteria lines will be evaluated individually. Add "CA" to the state column under the existing "CA".
After running the query, you can see your results have been refined even further. You have only those invoices from California that were issued on November 19, 2004 and April 20, 2004. To use multiple criteria in a query, you are not limited to using the separate criteria lines. By using operators, you can place your multiple criteria on the same line.
Using Operators in Queries
You can filter for multiple criteria on any given field by using operators. The following operators enable you to combine multiple values in different logical contexts so you can create complex queries:
- Or: Either condition can be true. Multiple criteria values for one field can either be separated on different criteria lines or combined in one cell with the use of the Or operator. For example, using your query you can filter for both California and Colorado by typing "CA" or "CO" in the Criteria field.
- Between: Tests for a range of values. For example, using your query you can filter for all invoices between 4/20/2004 and 11/19/2004 instead of testing just for those particular dates by typing Between #4/20/2004# and #11/19/2004# in the Criteria field.
- Like: Tests for string expressions matching a pattern. For example, you can filter for all records with a customer number that begins with the number 147 by typing Like "147*" in the Criteria field. The asterisk is the wild card character, which can signify any character or combination of characters.
- In: Similar to Or. Tests for all records that have values contained in parentheses. For example, you can filter for both California and Colorado by typing In ("CA", "CO") in the Criteria field.
- Not: Opposite of writing a value in Criteria. All records not matching that value will be returned. For example, you can filter for all states except California by typing Not "CA" in the Criteria field.
- Is Null: Filters all records that have the database value Null in that field.
- =, <, >, <=, >=, and <>: The traditional mathematical operators allow you to construct complex criteria for fields that are used in calculations.
For example, suppose you want to further refine your query so that only invoice amounts over $200 will be returned in the results. use the greater-than operator to filter the Sales_Amount.
After running the query, you can see that you narrowed your results down to just six records. These are the only records that match the multiple criteria that were designated in the query grid.
Exporting Query Results
Now that you have covered the basics of creating queries, you need to be able to export these results to Excel or another format. The simplest way to do this in Access is to right-click the query after it has been saved. Select Export and choose the appropriate file type. The query will take a snapshot of the data and save the results in the requested format.
In this tutorial:
- MS-Access Basics
- Access Tables
- Table Basics
- Exploring Data Types
- Creating a Table with Design View
- Access Field Properties and Primary Key
- Getting Data into Access
- Understanding the Relational Database Concept
- Splitting Data into Separate Tables
- Relationship Types
- Query Basics
- Creating Your First Select Query
